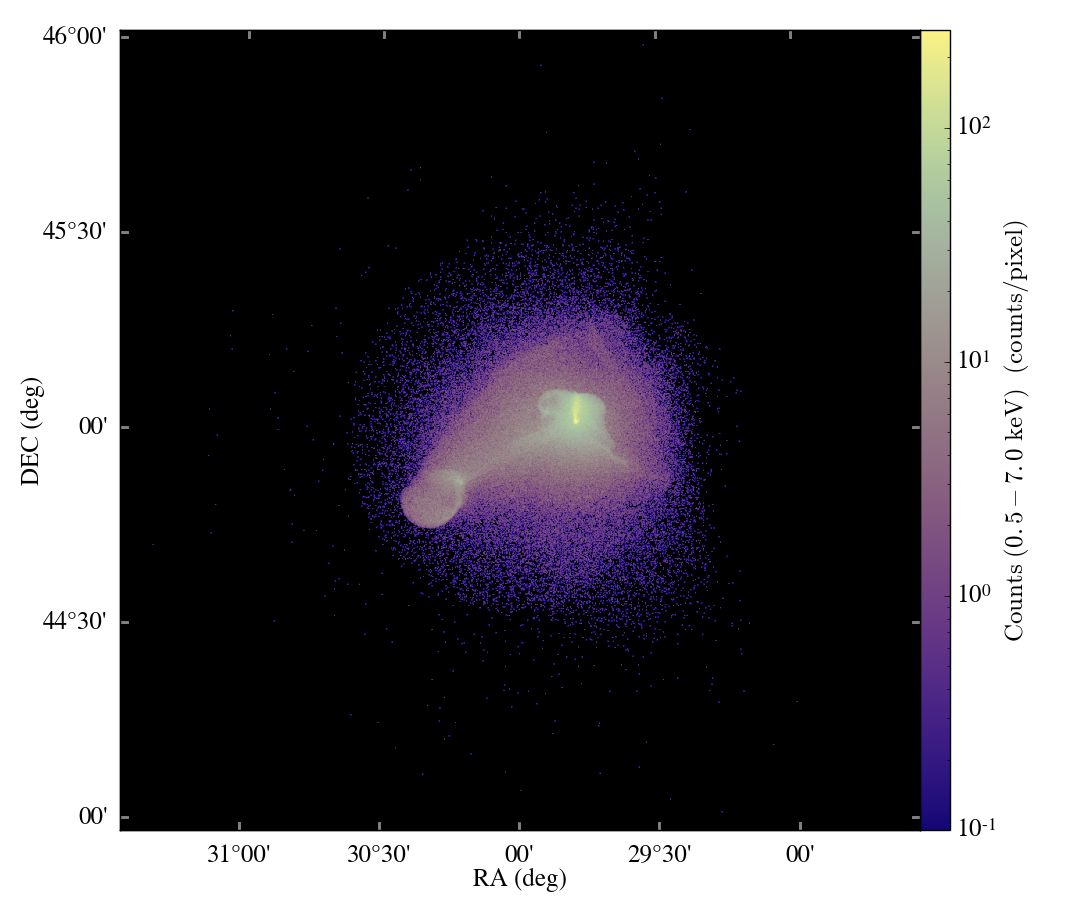
Not much yt development went on in the last week; I spent some time working with Enzo and driving forward simulation goals, which resulted in some development that directly benefited those simulation goals. However, this fortuitously coincided with work I have been eager to return to for quite some time: namely, time series analysis!
Time Series Analysis
The problem with time series analysis in yt has, to this point, been an issue of verbosity and clunkiness. Typically, unless using the EnzoSimulation class (which is only available as of right now for Enzo) one would set up a loop:
fn = 'DD%04i/DD%04i' % (pfi, pfi)
pf = load(fn)
process_output(pf)
This has always been somewhat dissatisfying for me. The idea of a “time
series” of data – another data object, moving along a temporal
dimension instead of spatial – has been more alluring, but difficult to
implement in a consistent way. In August of 2009 I tried my first
attempt at this, creating TimeSeries objects that contained multiple
parameter files, but it never went anywhere.
This week, overwhelmed with time series data, I spent some time bringing
this functionality in line with the current state of yt. The idea behind
it is that the underlying data and the operators that act on that data
can and should be distinct. The code can be seen in
yt/data_objects/time_series.py and
yt/data_objects/analyzer_objects.py. I have created a number of
analyzer objects which perform common tasks, as well as an easy method
for generating your own analyzer objects.
As of the current tip of the repository, the method for generating and
adding time series data is somewhat clunky; I can only guarantee it
works with Enzo data where the file OutputLog exists. The examples
below assume that.
You can now create a TimeSeries object and act on it; in this case we’ll
create an EnzoTimeSeries from the OutputLog, and we’ll find the
maximum density at all times.
from yt.mods import *
ts = EnzoTimeSeries('MyData', output_log = 'OutputLog')
max_rho = ts.tasks['MaximumValue']('Density')
You can see the (currently) available tasks by calling
ts.tasks.keys(). You can also set up chains of tasks to be evaluated
by constructing lists of AnalysisTask objects and feeding them to
ts.eval and you can create your own tasks as well. For instance, if
you wanted to look at the mass in star particles as a function of time,
you would write a function that accepts params and pf and then
decorate it with analysis_task. Here we have done so:
@analysis_task(('particle_type',))
def MassInParticleType(params, pf):
    dd = pf.h.all_data()
    ptype = (dd['particle_type'] == params.particle_type)
    return (ptype.sum(), dd['ParticleMassMsun'][ptype].sum())
ms = ts.tasks['MassInParticleType'](4)
print ms
I’m very excited about this, and I think it will be a centerpiece of the next major release of yt (and its affiliated documentation.) I also hope to see BrittonS’s EnzoSimulation class act as an initializer for this data object, so that more advanced selections of time series objects can take place when handling Enzo data.
libconfig
I’ve been spending some time looking at alternate configuration methods. This week I spent some time working with Enzo’s problem generation, which is in need of an overhaul, and attempting to expose it to yt to enable rapid construction of new initial conditions. I believe that Enzo may end up moving to libconfig-generatedconfiguration files, but the outcome of that is not certain. In order to future-proof yt I have included a modified version of libconfig and a wrapper around it.
This is in need of testing! If you would like to test it, and you are
using the development branch of the code, open up
yt/utilities/setup.py and change INSTALL_LIBCONFIG_WRAPPER = 0 to
INSTALL_LIBCONFIG_WRAPPER = 1 and try re-building yt. If this works,
we’re in the clear – and I’d very much like to hear about it, so drop
me a line!
Tab-completion
I have added tab-completion for field names in iyt. This means if you
do:
pf = load('DD0040/DD0040')
dd = pf.h.all_data()
dd['
and then hit tab, it will pop up a list of all possible fields that you can access. It only works for data objects as of right now.
Documentation
I’ve rebuilt the documentation a couple times this week, to add a table of contents for the field list, to update the changelog and to add a section on how to load data. The section on loading data is under “Analyzing Data” and is designed to help people get started with yt if they don’t know how to get started with getting their data in. It also includes a list of caveats for the various codes that are supported.
I also realized that the section on “How to Make Plots” was pretty empty, so I filled that in with information and links to the various methods of PlotCollection.
That about covers it. See you next week!


