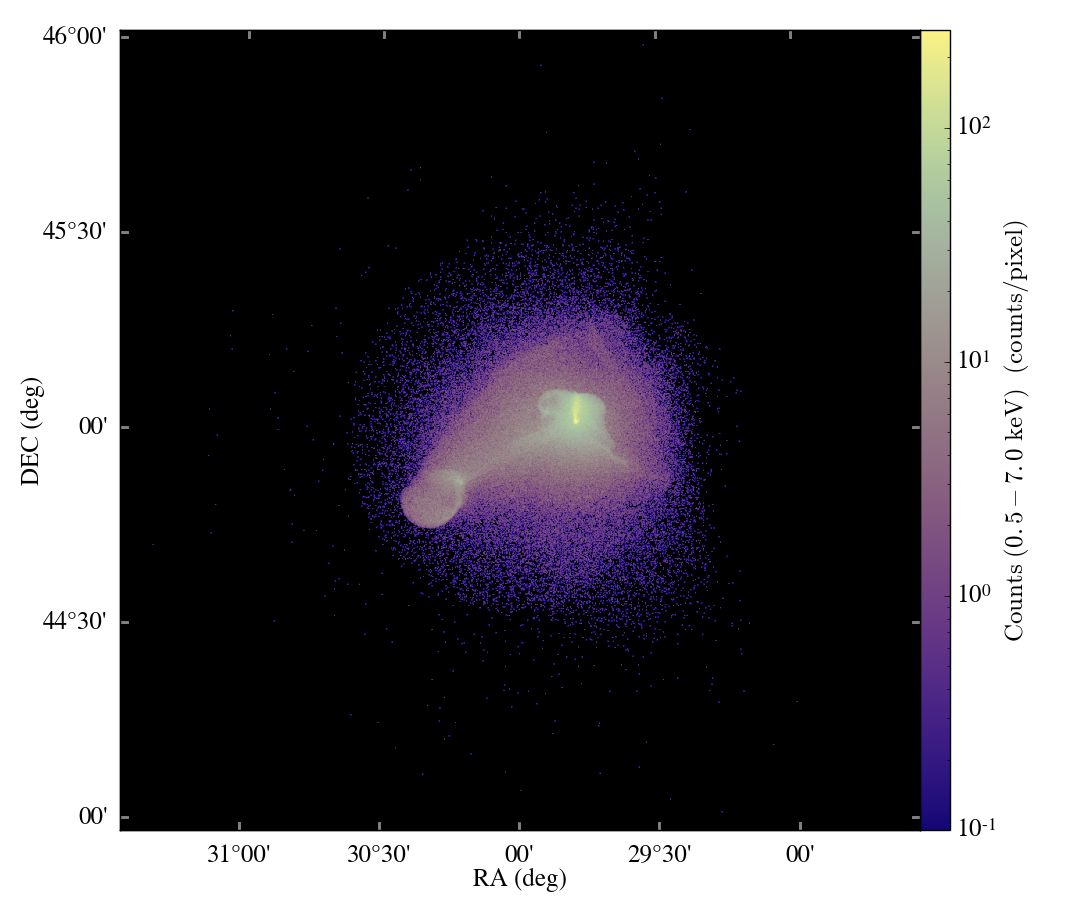
We’re proud to announce the release of version 2.4 of the yt Project, http://yt-project.org/ . The new version includes many new features, refinements of existing features and numerous bugfixes. We encourage all users to upgrade to take advantage of the changes.
yt is a community-developed analysis and visualization toolkit, primarily directed at astrophysical hydrodynamics simulations. It provides full support for output from the Enzo, FLASH, Orion, and Nyx codes, with preliminary support for several others. It provides access to simulation data using an intuitive python interface, can perform many common visualization tasks and offers a framework for conducting data reductions and analysis of simulation data.
The most visible changes with the 2.4 release include:
- A threaded volume renderer, which has been completely rewritten for speed, clarity and extensibility
- A new plotting mechanism, the “Plot Window,” for easier and more efficient visualization
- Many improvements to time series analysis, including auto-parallelization
- A complete rewrite of the Web GUI for yt including a WebGL 3D scene and substantial user interface improvements
- Integration with the new yt Hub (http://hub.yt-project.org/ ) for sharing of data, scripts and images
- Extensive additions and improvements to the cookbook
For a complete list of changes in this release, please visit the Changelog ( http://yt-project.org/docs/2.4/changelog.html ). Information about the yt project, including installation instructions, can be found on the homepage: http://yt-project.org/


