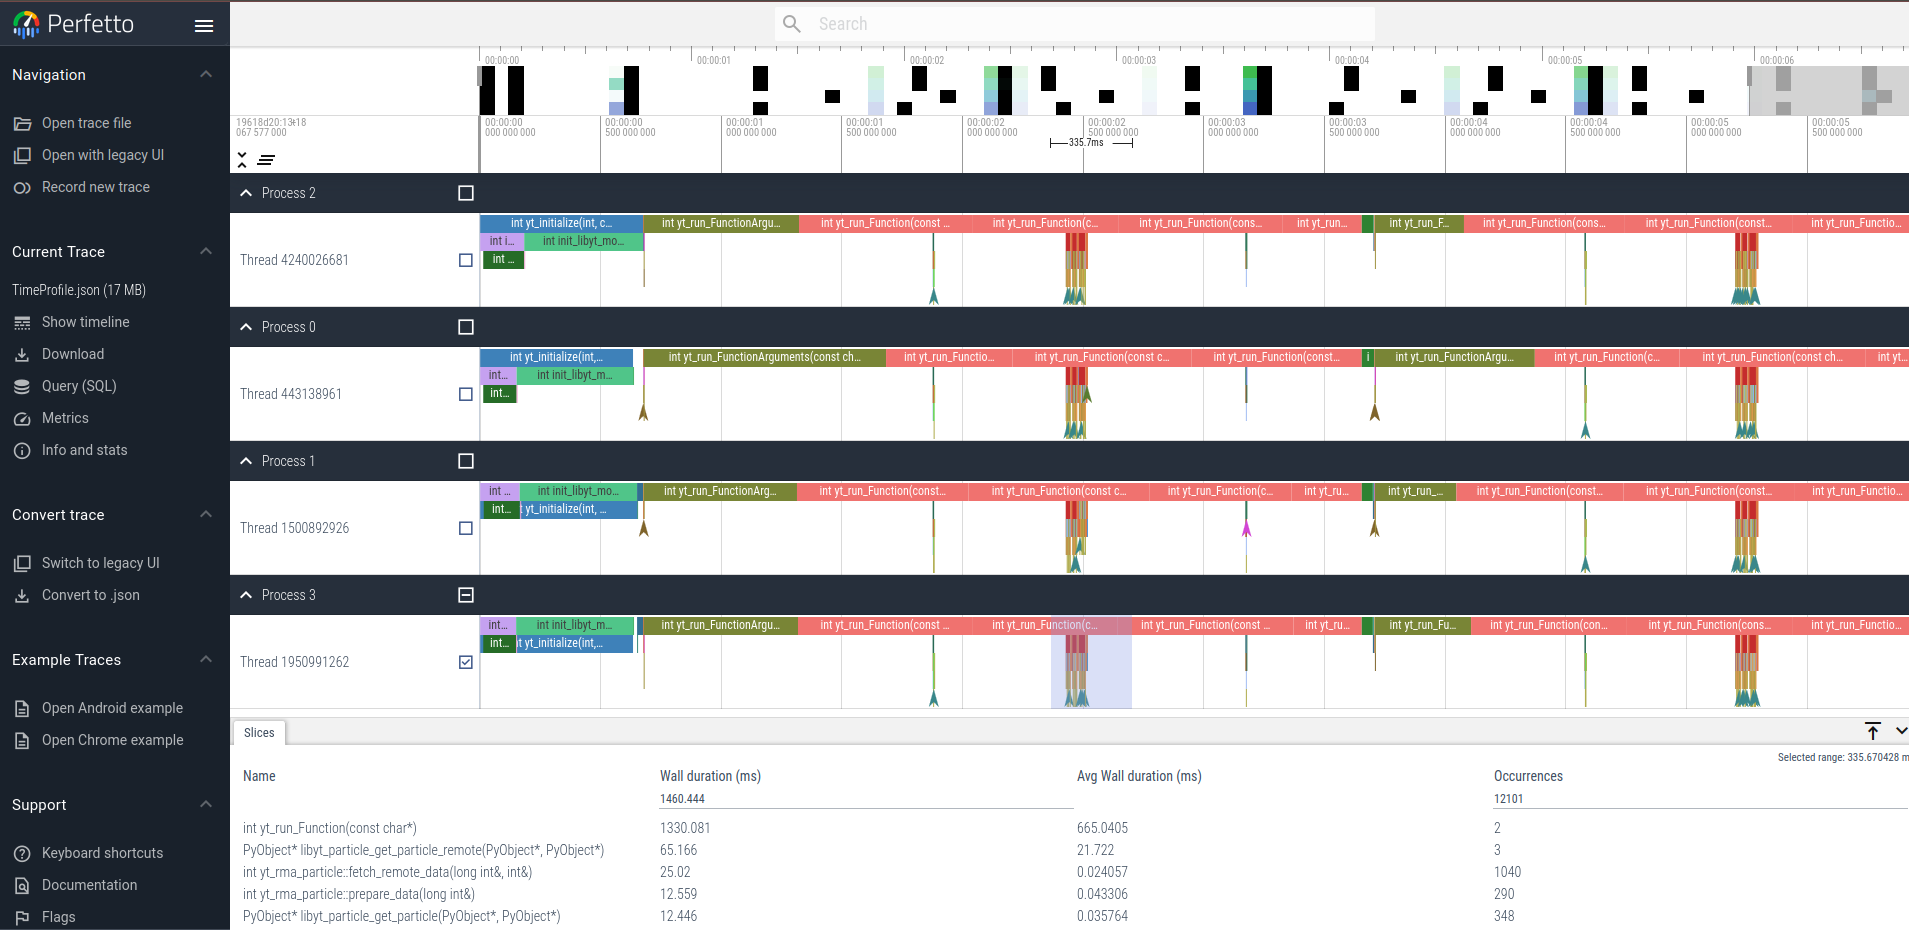
Time Profiling
Table of contents
How to Configure?
Compile libyt with -DSUPPORT_TIMER option. (See How to Install)
Visualizing the Profile – Chrome Tracing
- Since each process dumps its profile
libytTimeProfile_MPI*.jsonseparately, we run the following to concatenate all of them:cat `ls libytTimeProfile_MPI*` >> TimeProfile.json - Add
]}at the end ofTimeProfile.json. This is optional, and we only need to add
 ]}if Perfetto doesn’t recognize the file. - Open Google Chrome and enter
chrome://tracing, or go Perfetto. -
Load the time profile
TimeProfile.json.